
Data Dash – Data: Bar Graphs & Pictographs Adventure – CN Tower (Canada)
Data Dash – Data: Bar Graphs & Pictographs Adventure – CN Tower (Canada)
Sub total
$12.99Vendor
Excavating AdventuresEstimated shipping: 1-2 Business days from order date.
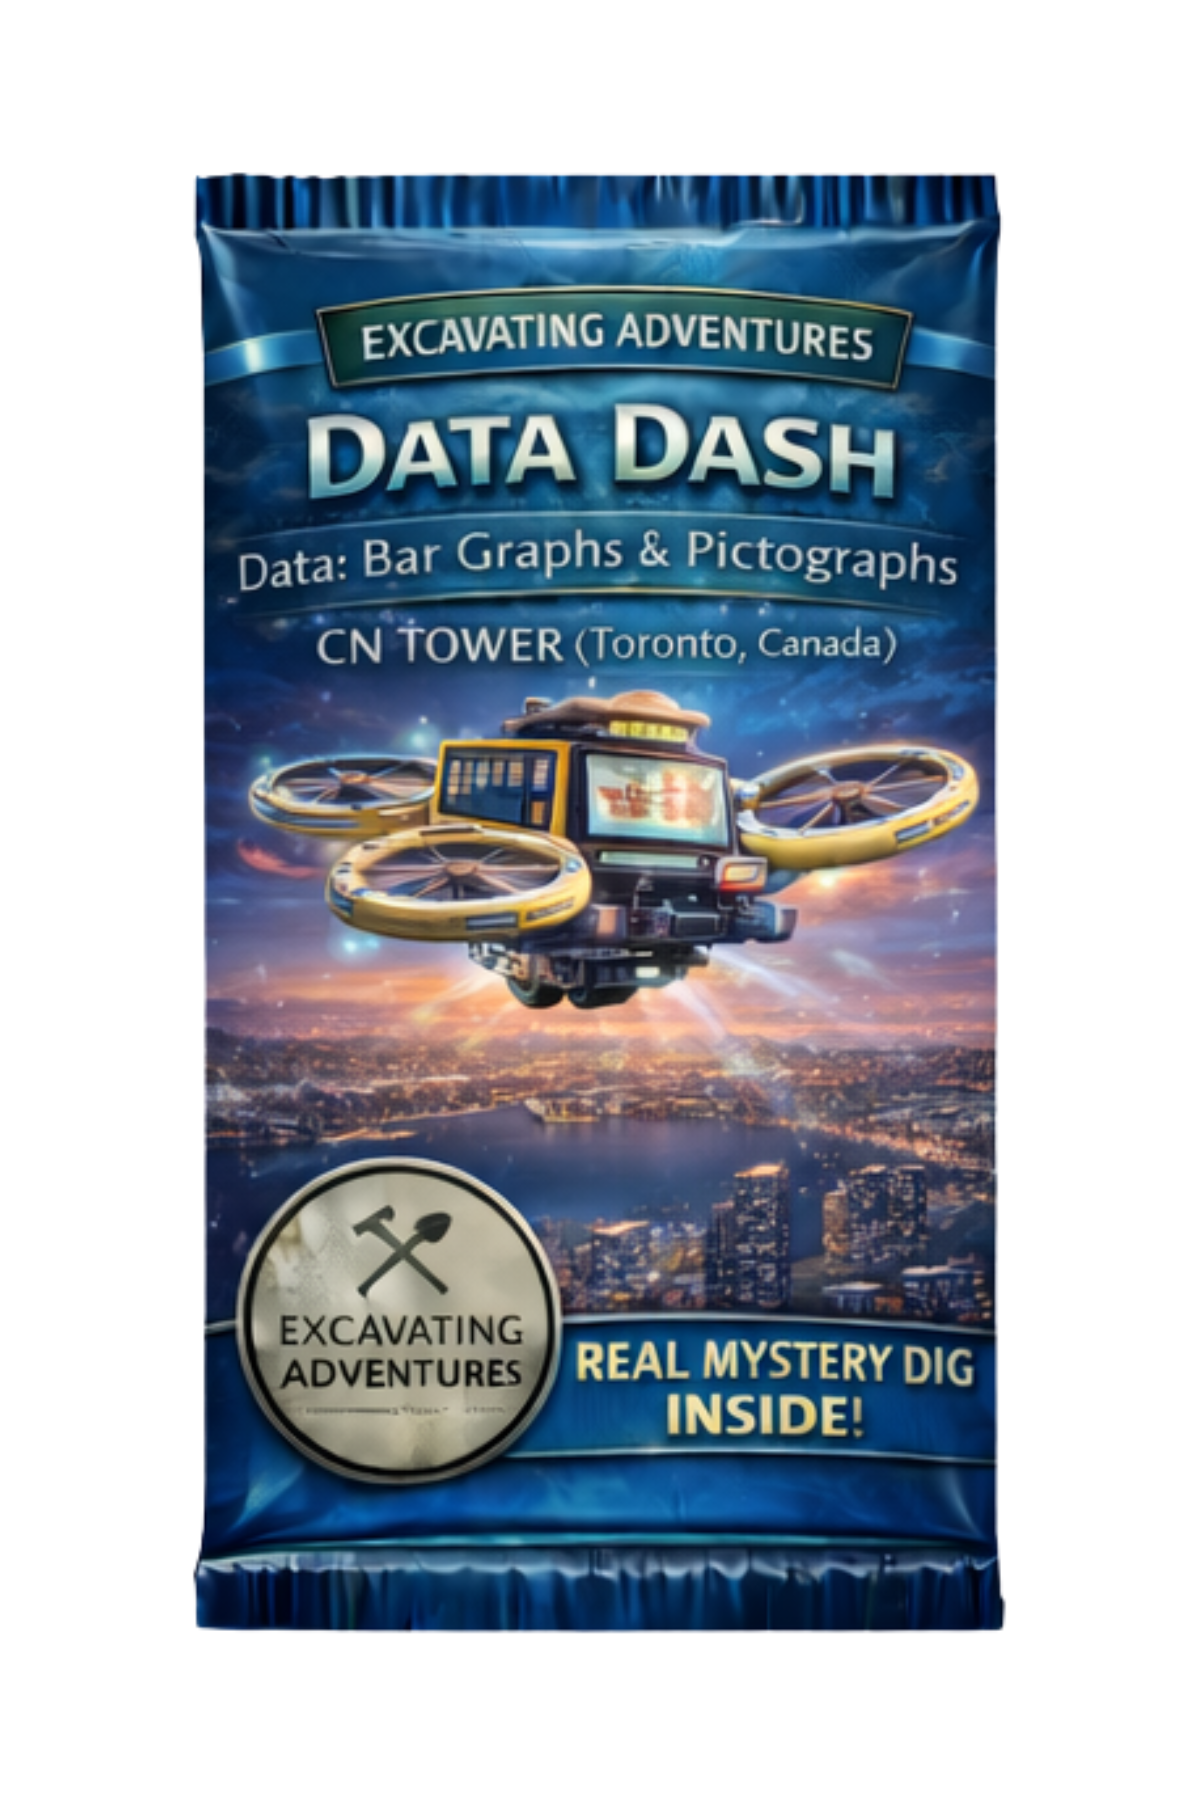
Data Dash at CN Tower
Data: Bar Graphs & Pictographs Adventure Pack
High above Toronto, the observation deck at CN Tower is buzzing with activity — but something is wrong with the data screens. Visitor counts are mismatched. Graph bars are uneven. Symbols on pictographs are misrepresented. Ari Raider has detected a disruption in the data network. If explorers cannot organize and interpret the information correctly, the entire reporting system could fail.
In Data Dash at CN Tower, students soar in on the Skydeck Data Drone and enter a high-stakes data mission. To restore order, explorers must collect data using tally marks, determine frequency, and represent information using pictographs and bar graphs. By reading scales, identifying labels, interpreting results, and comparing data sets, students bring clarity back to the tower’s information systems.
This adventure blends foundational data analysis skills with visual reasoning and real-world problem-solving.
About This Adventure Pack
Data Dash at CN Tower is designed for elementary explorers and connects directly to an interactive online adventure.
Students can complete the Data Dash at CN Tower adventure online for free, including access to free printable trading cards that match this experience. The online adventure delivers the full learning and story-driven mission without requiring a physical kit.
👉 Explore the free Data Dash at CN Tower adventure here: Coming Soon
For families or classrooms that want to extend the experience, this Adventure Pack adds collectible cards and hands-on components that bring the data mission into the physical world. The learning experience is the same whether students use the physical pack or not. The pack simply adds a tactile, collectible layer to the adventure.
What This Adventure Covers
Each Data Dash at CN Tower Adventure Pack explores core Data: Bar Graphs & Pictographs concepts, including:
• Data – Information collected for analysis
• Tally Marks – Marks used to count and organize information
• Frequency – How often something occurs
• Pictograph – A graph that uses pictures or symbols to represent data
• Bar Graph – A graph that uses bars to show amounts
• Scale – The numbers that show the value of intervals on a graph
• Labels – Words that describe what the graph represents
• Interpret – To explain what the data shows
• Compare Sets – Looking at two or more groups of data to see similarities or differences
Each concept appears naturally within the adventure and is required to move the story forward, reinforcing data literacy through exploration rather than memorization.
What’s Inside the Pack
• Adventure-Filled Field Pack (6×9 Adventure Pouch)
• Adventure Mission Card
• Interactive Online Adventure
• Knowledge Card Pack
• Mystery Dig Kit
• Dig Stick Tool
• Cleaning Wipe
• Mystery Collectible Specimen (Gemlet)
• Gemlet Storage Container
• Excavating Adventures Sticker
Why Kids Love It
Exploring a towering landmark, collecting real-world style data, building graphs, and uncovering a real mystery specimen makes math feel powerful and interactive.
Why Teachers and Parents Love It
Data Dash at CN Tower supports elementary math standards focused on representing and interpreting data. Students build analytical thinking skills while practicing reading and creating graphs.
The adventure works for whole-class instruction, small groups, math centers, or independent practice — with or without the physical pack.
Free Adventure Option
Data Dash at CN Tower is also available online for free, including free printable trading cards that align directly with this adventure. No purchase is required to participate.
This reflects our mission at Excavating Adventures: to make engaging, story-driven adventures accessible to everyone.
👉 Explore the free Data Dash at CN Tower adventure here: Coming Soon